Introduction to HD and CAG
HD is an autosomal dominant, progressive neurodegenerative disease caused by an expansion of the CAG tract in the HTT gene located on chromosome 4. Healthy individuals have between 10 and 35 CAG repeats, though there is some evidence that those with 27 to 35 CAG repeats, known as intermediate alleles, may show signs of onset later in life (Groen et al. 2010). HD gene expansion-carriers (HDGECs) have 36 or more CAG repeats. Those with 36-39 repeats have reduced penetrance, meaning some will develop HD symptoms in their lifetime, while others will not (McNeil et al. 1997). People with 40 or more CAG repeats have full penetrance and will develop HD within a normal lifetime.
The age at which HDGECs experience onset of motor signs is associated with the CAG repeat length, and those with more than 60 CAG repeats are likely to exhibit signs very early and develop juvenile HD before reaching adulthood (Fusilli et al. 2018). In HD observational studies the most commonly occurring CAG length is 42, with most HDGECs ranging from 40 to 44 CAGs. CAG length distribution for Enroll-HD is shown in Figure 1.
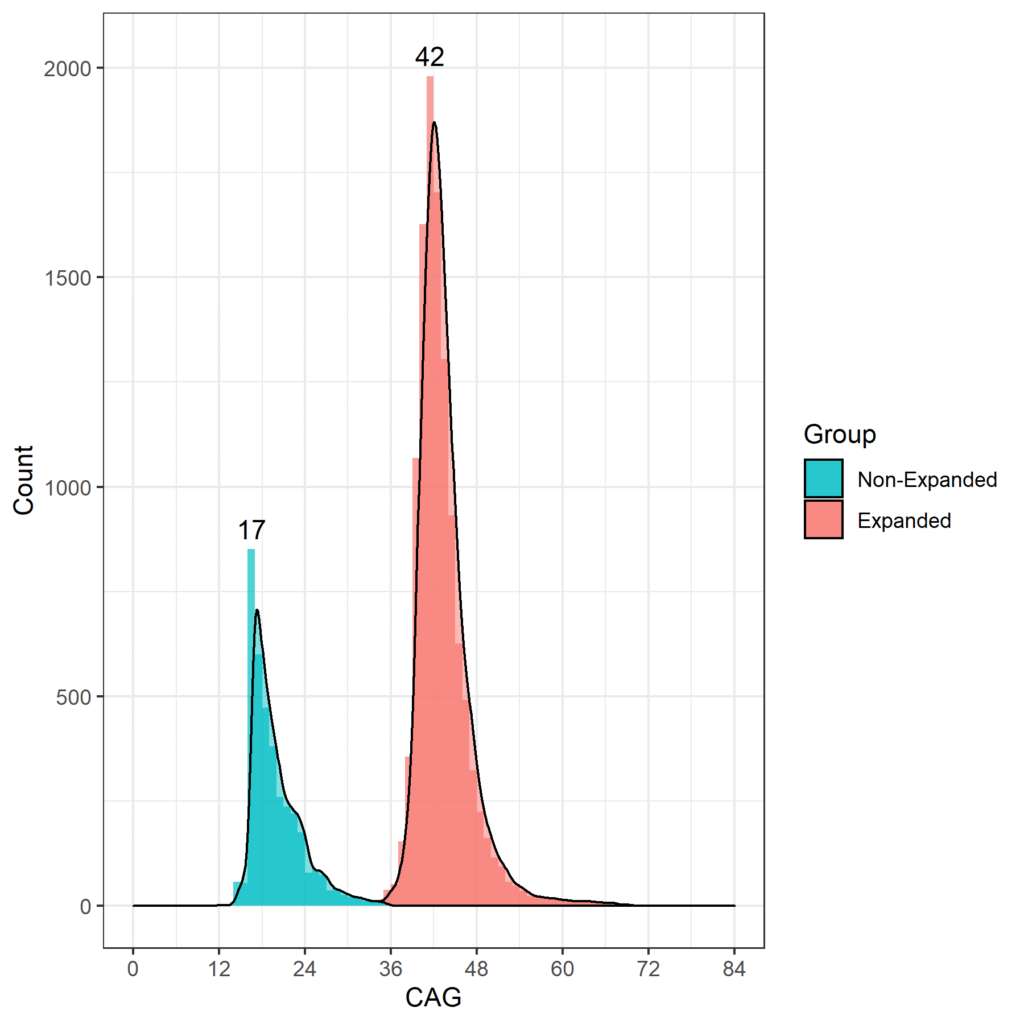
Figure 1. Distribution of CAG lengths in the Enroll-HD population. Distribution of CAG repeat lengths in non-HDGECs and HDGECs in Enroll-HD illustrated separately. Modal values for each group explicitly listed. (PDS4 release; v2018-10-R3).
HD Onset and Diagnosis
HD onset and diagnosis are important concepts of critical interest to many researchers. In this section we discuss these complex concepts in detail, and the nuances of the variables that capture them in the Enroll-HD study.
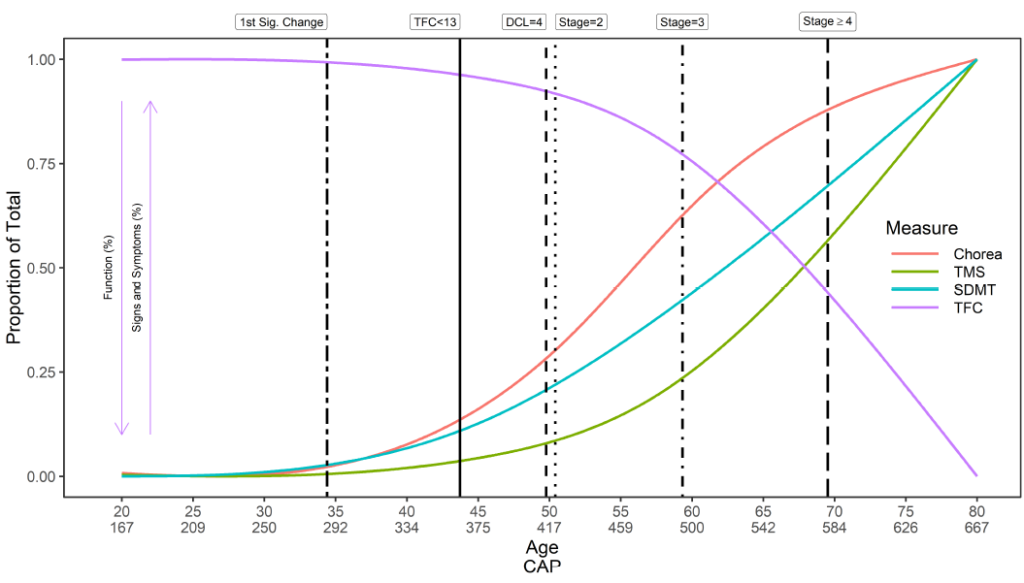
HD onset is complex. A generic overview of the natural history of HD with regards to timing of initial symptom onset, diagnosis, and progression, is provided (Figure 2). However, the timing of symptom onset, order of presentation, and consequent trajectory of symptoms in each domain—motor, cognitive, functional, and behavioral—are unique to each participant. Similarly, an individual may be diagnosed in different ways at different times. Enroll-HD therefore collects data on a multitude of variables relating to timing of initial symptoms, disease onset, and diagnosis (Table 1).
In Enroll-HD, dates relating to onset of first signs/symptoms are captured as reported from several perspectives; the participant, their family, and the Enroll-HD clinician/rater.
Onset dates pertaining to specific signs/symptoms in each domain are also captured. These are completed from the clinician/rater’s perspective, based on their best judgement. This takes into account participant and family reports, available history from medical records, as well as Enroll-HD assessment score.
The term ‘clinical diagnosis’ is used to denote the unequivocal onset of symptoms or signs attributed to HD, which can occur at vastly different times for each individual HDGEC. In the Enroll-HD protocol a clinician-based judgement of “manifest” disease status, as indicated in Enroll-HD by participant category (i.e., hdcat), is based on signs/symptoms in any of the disease domains (i.e., motor, cognitive, behavioral).
Enroll-HD also captures the date of clinical HD diagnosis (hddiagn). This variable represents the date on which a participant is informed by a clinician that the disease is evident. However, this can be years after actual symptom onset if the participant has not been seen by a doctor. If the date of first diagnosis is unknown and cannot be identified, hddiagn can be missing, even if a clinician is confident in their diagnosis of symptomatic HD and has correspondingly marked hdcat as manifest.
An alternative definition of disease onset, also termed “manifest” and widely used in the HD literature, concerns the transition from pre-symptomatic to symptomatic HD based on motor signs only; this is known as motor onset or motor diagnosis. This definition is based on a Diagnostic Confidence Level (DCL) score (i.e., diagconf) of 4, which indicates a clinician’s confidence that, based on the UHDRS Motor assessment, motor signs unequivocally represent HD (≥ 99% confidence). Provided a participant was not classified as hdcat = ‘manifest’, or diagconf = ‘4’, at study entry (i.e., at baseline visit), the date of the visit at which either of these variables are updated to the values above can be used to indicate date of clinical onset, as outlined respectively above.
Genetic diagnosis of HD can be done prior to symptom onset (known as a “predictive test”) or to confirm a clinical diagnosis (known as a “diagnostic test”). Genetic testing is voluntary, and tests are completed at local labs for some, but not all, Enroll-HD participants. Separately, all Enroll-HD participants undergo CAG-repeat genotyping at a central research laboratory. These results are used solely for research as opposed to diagnostic purposes, and are never shared with participants, investigators, or sites. As previously mentioned, an individual is an HDGEC if they have 36 or more CAG repeats. In symptomatic individuals without family history of HD, clinical diagnosis is confirmed by genetic testing; therefore, date of local genetic testing (i.e., lbdtc) may be used as “date of clinical diagnosis” in such cases. In asymptomatic individuals with family history who undergo predictive testing, date of genetic testing may be used as “date of genetic diagnosis.” Note however that date of local genetic testing is never made available in Enroll-HD data releases.
HD Disease Severity
Important milestones in disease progression are somewhat limited in the HD field. The Shoulson-Fahn I-V staging system (Shoulson & Fahn, 1979), based on the UHDRS Total Functional Capacity (TFC) score, is traditionally used to categorize symptomatic individuals into disease stages; I being the least severe, V the most severe. TFC score is captured in Enroll-HD.
Disease severity can also be characterized in terms of CAP score. CAP score stands for CAG-Age-Product (i.e., the product of excess CAG length and age), and provides a measure of cumulative exposure to mutant HTT (akin to the ‘pack-years’ metric commonly used in tobacco research as a proxy for tobacco exposure). In Enroll-HD, CAP is calculated according to following formula (Warner et al., 2020):
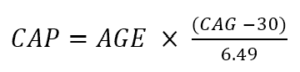
The above formula is standardized such that CAP = 100 at the expected age of diagnosis. For more info on CAP, check out “Age and CAG length in HD Data Analysis”.
HD assessments in Enroll-HD
The Enroll-HD assessment battery was developed to allow systematic and comprehensive evaluation of HD. Core data components—which are mandatory and must be completed or reviewed and updated at each annual visit—include participant demographic information, HD clinical characteristics, comorbid conditions, disease-related treatments and other therapies, and several assessments designed to assess motor, function, behavioral, and cognitive performance, including several Unified Huntington’s Disease Rating Scale (UHDRS®’99) component scales. Extended assessments—which are optional for completion at each visit—comprise additional tests of motor, behavioral, and cognitive function, along with quality-of-life assessments and health and economic impact measures. The Enroll-HD study page lists all Data Elements and Assessments captured in Enroll-HD.
Here we discuss two of these assessments—the UHDRS and PBA-s—and highlight some exciting (well, notable) quirks to be aware of with regards to the data they generate.
UHDRS®’99
The UHDRS®’99 comprises motor, cognitive, and functional components designed to measure HD progression in each domain.
Motor signs are evaluated by the Total Motor Score (TMS). The scale is comprised of 31 items, including oculomotor, rigidity, dystonia, and chorea, rated from 0 (no abnormalities) to 4 (most severe motor impairment). The total score is the sum of scores for all items and ranges from 0 to 124, with higher scores indicating increased motor impairment. Care must be taken when analyzing TMS data because of highly skewed data consistent with a floor/ceiling effect (Figure 2). Individuals early in the course of HD progression will show fewer signs of motor impairment and score at the top of the scale (i.e., at or near zero). Appropriate statistical methods, such as transformation or use of negative binomial regression, should be considered.
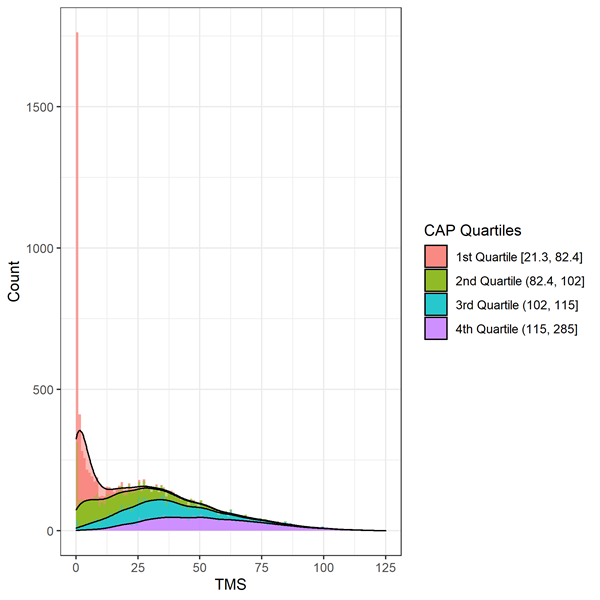
Figure 3. Distribution of baseline TMS by CAP deciles in Enroll-HD. Warner et al. (2020) CAP score formula used, which is standardized such that CAP = 100 at the expected age of diagnosis.
Cognitive ability is assessed using several tests that measure skills such as visual attention and processing speed (Symbol Digit Modalities Test), basic attention (Stroop Word Reading and Color Naming Tests), and response inhibition (Stroop Interference Test). Lower scores on these tests signify decreased cognitive performance.
Daily functioning is measured by three scales, the Total Functional Capacity (TFC), Functional Assessment Scale (FAS), and Independence Scale (IS). The TFC is the primary assessment of daily functioning in HD with ratings in five domains: occupation, finances, domestic chores, activities of daily living, and care level. The TFC total score is the sum of the scores from each of these domains and ranges from 0 (loss of function) to 13 (full function). Like the TFC, lower scores on the FAS (range = 0–25) and IS (range = 0–100) indicate a decline in functional ability. The functional measures are also affected by ceiling effects with inflation at the maximum scores because those early in HD progression often maintain full functioning as rated by the scales. As with TMS, the use of appropriate statistical methods is encouraged.
Problem Behavioral Assessment Short Version
The Problem Behavioral Assessment Short Version (PBA-s) assesses the frequency and severity of an extensive range of behaviors, including depressed mood, self-esteem, anxiety, suicidal thought, aggressive behavior, irritability, perseveration, compulsive behaviors, delusions, hallucinations, and apathy. While the behavioral signs are important for individuals and their quality of life, they generally have not been found to track with HD progression as strongly as the motor, cognitive, and functional measures (Tabrizi et al. 2013; Paulsen et al. 2014). Nevertheless there is evidence that apathy is associated with the progression of HD (Kingma et al. 2008; McColgan & Tabrizi 2017).