Enroll-HD Data Handling and Management Tips
A brief introduction to Enroll-HD data handling and management (not a substitute for reading the dataset documentation – but a good place to start!)
Introduction
Enroll-HD is an observational study and clinical research platform that began in 2012 and has recruited ~24,000 participants from ~160 sites on four of the world’s continents. It is designed to advance our understanding of HD, improve and support the design and conduct of clinical trials, and improve clinical care for HD patients.
Data from the Enroll-HD study are made available for analysis to verified researchers through the Enroll-HD website in two ways: periodic datasets (PDS) and specified datasets (SPS). Periodic datasets are time-stamped cuts of the Enroll-HD clinical dataset prepared every 1-2 years, and include the large majority of the variables collected (certain variables are suppressed, aggregated or transformed to minimize risk of participant identification). Every participant within the dataset has completed a baseline visit, and most have longitudinal data from annual follow-up visits. Access to the Enroll-HD PDS is quick and straightforward. Full details are provided on the Access page.
The Enroll-HD PDS releases contain eleven distinct datasets, some of which are participant-based while others are visit-based. The participant-based datasets have one row (or observation) for each participant and include demographic data that is not specific to a visit. In contrast, the visit-based datasets contain data that are collected at each visit and have multiple rows for participants with more than one visit. For example, a participant’s sex and CAG length (i.e., caghigh) are included in a participant-based dataset in a single row (as in Table 1), while the Total Motor Score (i.e., motscore) is part of a visit-based dataset with a row for each participant visit (as in Table 2). In general, a row in the PDS corresponds to a participant (or a visit for a participant) and a column corresponds to a variable, such as sex, caghigh, or motscore. Please refer to Explore Dataset Structure for more detailed information on dataset structure.
Enroll-HD Dataset Management
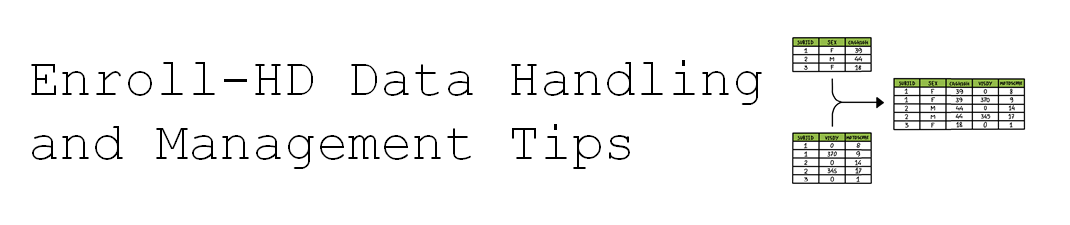
Dataset structure is important to understand so that the data can be combined properly for analysis. Two key variables are used to combine the data; the participant ID (i.e., subjid), which is unique and links his/her data across both participant- and visit-based datasets (Tables 1 and 2), and the number of days in the study (i.e., visdy), which is used in visit-based datasets (Table 2) and has a value of zero at baseline visit and the number of days since then at subsequent visits (e.g., a value of 370 represents 370 days after the first visit). The combination of subjid and visdy is necessary to merge data.
Table 1. Participant-based data example
subjid | sex | caghigh |
1 | f | 39 |
2 | m | 44 |
3 | f | 18 |
Table 2. Visit-based data example
subjid | visdy | motscore |
1 | 0 | 8 |
1 | 370 | 9 |
2 | 0 | 14 |
2 | 345 | 17 |
3 | 0 | 1 |
Merging is integrating data from one dataset into another (adding columns) and is necessary when data to be analyzed are within multiple datasets. The number of rows is generally the same as the larger of the original datasets. For example, most analyses require both demographic and clinical data, but these are contained in two different datasets (profile and enroll respectively). The analysis dataset can be obtained by merging the demographic and clinical datasets by subjid and visdy. Table 3 shows the result after merging Table 1 and Table 2.
Table 3. Result after merging participant- and visit-based datasets
subjid | sex | caghigh | visdy | motscore |
1 | f | 39 | 0 | 8 |
1 | f | 39 | 370 | 9 |
2 | m | 44 | 0 | 14 |
2 | m | 44 | 345 | 17 |
3 | f | 18 | 0 | 1 |
Subsetting is another important technique in dataset management, which is filtering a dataset to include only participants who meet a certain criterion (removing rows). After subsetting the number of rows in the new dataset is fewer than in the original dataset. For example, some analyses might focus on HDGECs, which requires removing those without the gene expansion from the dataset. Table 4 shows the result after subsetting Table 3 for HDGECs.
Table 4. Result after Subsetting of Dataset for HDGEC
subjid | sex | caghigh | visdy | motscore |
1 | f | 39 | 0 | 8 |
1 | f | 39 | 370 | 9 |
2 | m | 44 | 0 | 14 |
2 | m | 44 | 345 | 17 |
A third technique in dataset management is creating derived variables, which are defined by a function or grouping in terms of other variables. One category of derived variables is a total score; many total scores are included in the PDSs, including motscore and functional measures TFC (i.e., tfcscore) and FAS (i.e., fascore). A second category of derived variables is a composite score, which are often created for use in or as the result of an analysis. The CAP score (described in other articles in this series; Warner et al. 2020) is generated using age and caghigh. The Prognostic Index (Long et al. 2017) uses age, caghigh, and motscore along with a cognitive measure, the Symbol Digit Modalities Test (i.e., sdmt1). The composite UHDRS (cUHDRS; Schobel et al. 2017) is computed from motscore, tfcscore, and sdmt1 plus a different cognitive measure, the Stroop Word Reading Test (i.e., swrt1). These composite scores are important to understanding HD progression.
Enroll-HD Missing Data
Missing data values are inevitable in large observational studies, and two overarching missing data categories are relevant to PDS releases: system-defined missing data (indicated by blank variable values), and user-defined missing data (indicated by specific codes that indicate reason for missingness). User-defined missing data occur where a mandatory variable field, as determined by the EDC system, is not completed, or where the value entered into the EDC is known to be wrong. The PDS provides additional information about four possible reasons for user-defined missing data; the data value is known to be ‘wrong’ or highly questionable, which can be due to administration or instrumentation error; the item is ‘not applicable’, which is the case when the item cannot be answered by the participant or does not apply due to certain circumstances; a ‘missing value’ that results from either participant refusal to share or accidental omission of the data; the data are ‘unknown’ by the participant and/or the administrator (only applies to specific variable fields). The missing value codes for these four reasons are shown in Table 5.
Table 5. Missing value codes
Missing value | Wrong | Not applicable | Missing | Unknown |
Numeric values | 9996 | 9997 | 9998 | 9999 |
Text values | WRONG | NOTAPPL | MISSING | UNKNOWN |
Enroll-HD Supporting Documents
Enroll-HD data support documentation includes general study documentation (e.g., study protocol, data dictionary, annotated CRFs), coding system guides, and dataset-specific documents, including new guidance on how to understand and interpret the data. These documents will aid researchers in their analyses, and we encourage all users to review this documentation in advance of their data analysis.
References
Landwehrmeyer BG, Fitzer-Attas CJ, Giuliano JD, et al. Data Analytics from Enroll-HD, a Global Clinical Research Platform for Huntington’s Disease. Movement Disorder Clinical Practice 2016;4: 212–24.
Warner JH, Long JD, Mills JA, Langbehn DR, Ware JJ, Mohan A, & Sampaio C. Standardizing the CAP Score in Huntington’s Disease I: Predicting Age-at-Onset. 2020.
Long JD, Langbehn DR, Tabrizi SJ, et al. Validation of a prognostic index for Huntington’s disease. Mov Disord 2017;32(2):256–263.
Schobel SA, Palermo G, Auinger P, et al. Motor, cognitive, and functional declines contribute to a single progressive factor in early HD. Neurology 2017;89(24):2495–2502.